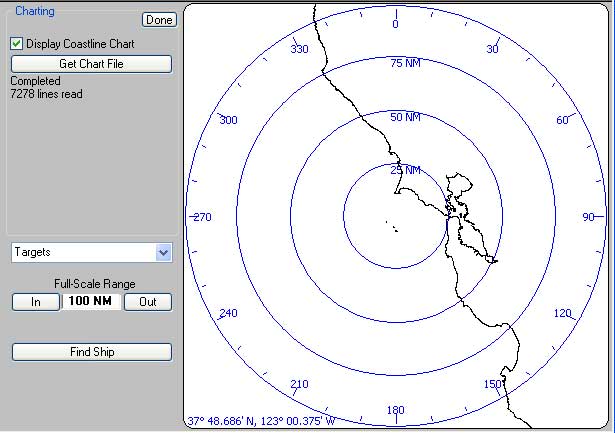
Coastline Chart of the San Francisco Bay Area, using the "World Vector Shoreline" Database (Designed for 1:250,000 Scale)
A Windows Program for the Display, Capture, and Playback of NMEA data.
Coastline Plotting
Important Disclaimer: The coastline plotting described here is not a substitute for proper navigational charts. Their accuracy has not been verified, nor do these plots indicate submerged rocks, shallow water. etc. They are intended for use as a visualization aid only.
Further Disclaimer: Due to the simplified geo-coordinate math being used in NavMonPc, there will be large distortions and position errors when using charts that cover a large area. These errors are not significant when displaying a relatively small area (such as a radius of a few hundred miles). I plan to change the plotting math to use great-circle calculations exclusively, but this is a big job and will take some time to do correctly. Until them, please be aware of the limitations.
Starting with Version 0.43 there is now the ability to read and display "Coastline Data", freely available from the NOAA at http://rimmer.ngdc.noaa.gov/ . Through this NOAA website, you can access and download selected portions of several worldwide coastline databases. These databases range from the low-resolution "WCL" (World Coastline, designed for 1:5,000,000 scale), to the much higher resolution "NOAA/NOS Medium-Resolution Coastline" (designed for 1:70,000 scale, USA coastline only).
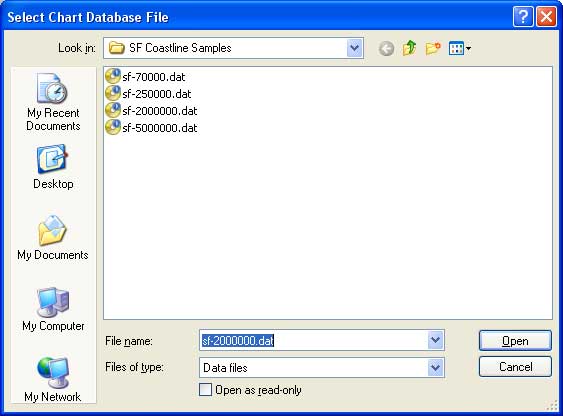
To download a portion of one of these databases, go to the NOAA Coastline Data website and enter the latitude and longitude of the north/south/east/west limits of the area in interest. Then, select the appropriate database, compression method (I suggest Zip), and select the "Mapgen" format. It may be helpful to select the "GMT Plot" preview option. Then, click on the "Submit" button. After a brief wait, you will be taken to a new page where your file can be downloaded. Download it, and save it somewhere convenient. I suggest that you keep these files small, under 10,000 points if possible, since displaying them does take a large amount of computing power and large coastline plots may cause your computer to become quite sluggish.
You will then need to extract (unzip) the data file, which will be placed in a subdirectory created during the unzip process. At this point you will probably want to rename the ".dat" file something memorable.
You are now ready to load your coastline data file into NavMonPc.
Do this from the AIS screen. Once there, click the “More Options” button, then the “Coastline Chart” button. You will now see the “Get Chart File” button. Clicking this brings up a standard Windows “file picker” window. Navigate to where you have stored your coastline chart and select it.
The chart file will be read, and when this is complete the status line
(under the “Get Chart File” button) will display the number
of lines successfully read.
If the “Display Coastline Chart” checkbox isn’t already
checked, click on it now. The coastline should now be displayed on
the AIS dial. If you don’t see the coastline, make sure that NavMonPc has
Latitude and Longitude inputs, and that these are fairly close to the coastline
location. If you have a GPS connected to NavMonPc you should have lat/lon already
available. You can also hand-enter lat/lon on the primary “Options/Options” screen.
Here you can select either the GPS or the user-entered position.
If you get
into trouble by reading a too-large file, click the "Get Chart File" button
again. This should cancel the file read. You can load new coastline files
as often as you want -- the previous data will be overwritten. The currently
in-use coastline chart will be saved on program exit, and will be reloaded
the next time the program is run.
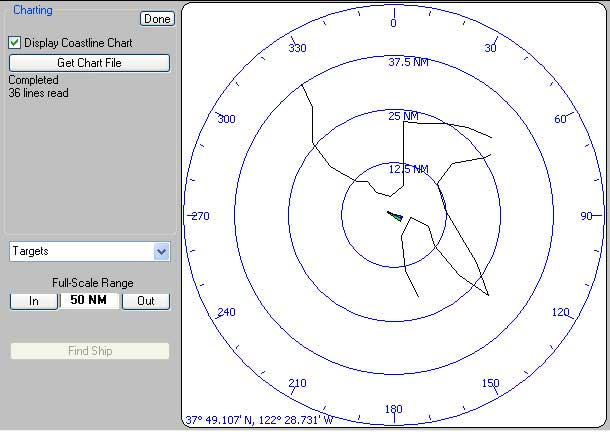
This should do the trick. Note that you should try to keep the coastline
file fairly small. I sometime use a coastline chart of San Francisco
bay that contains about 20,000 points, and my computer does start
to bog down.
By the way, if you have selected Magnetic North-up display (see
the “Options/Options” screen),
and do not have either a GPS-provided or a user-entered magnetic
variation value, the AIS targets will all be pointing up, regardless
of their
course or heading.
About the .dat files:
These .dat files have a very simple format: they are lists of line segments, with each segment end having a longitude and latitude. Segment ends are indicated with a "# -b". Here is a small coastline chart, covering the range of 37.5 to 38.5 Degrees north, 122 to 123 degrees west, extracted from the 1:5,000,000 WCL database:
| # -b -122.358310 37.499999 -122.422654 37.603339 -122.446123 37.734762 -122.401533 37.812208 -122.312353 37.777005 -122.279498 37.699560 -122.157462 37.584565 -122.014305 37.504772 -122.070629 37.636195 -122.225520 37.838023 -122.267763 37.943630 -122.190318 38.021076 -122.026039 38.046891 -122.000000 38.056406 # -b -122.000000 38.123480 -122.115219 38.161886 -122.225520 38.178314 -122.345209 38.178314 -122.434389 38.187701 -122.434389 38.075053 -122.434389 37.934243 -122.500100 37.892000 -122.565811 37.908428 -122.610401 37.953018 -122.666725 37.953018 -122.744171 37.985873 -122.798148 38.011689 -122.875594 38.091481 -122.887328 38.107909 -122.887328 38.152499 -122.887328 38.220557 -122.887328 38.239332 -122.941305 38.335552 -122.999999 38.380345 |
 San Francisco Bay Area Coastline, WCL Database (1:5,000,000) |
Obviously, this small scale (low-resolution) plot is of limited value here, but what do you expect from 34 endpoints? Here is a plot of the same general area, using the NOAA/NOS Medium-Resolution Coastline database:
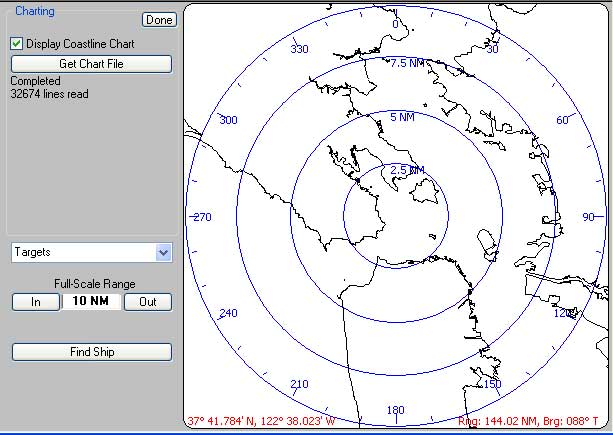
San Francisco Bay Area Coastline,
NOAA/NOS Medium-Resolution
Coastline database (1:70,000)
Here is a zoomed-in view:
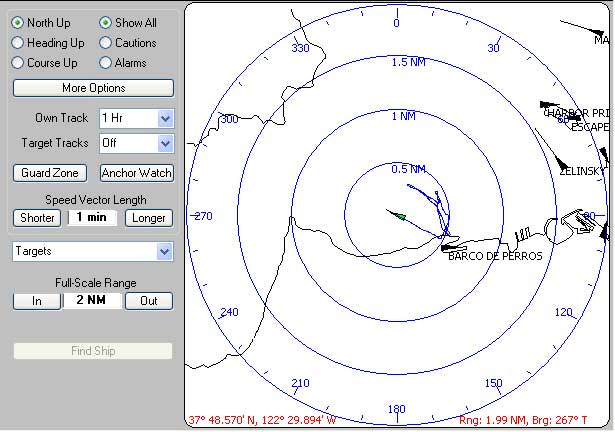
San Francisco Bay Area Coastline,
NOAA/NOS Medium-Resolution Coastline database (1:70,000)
If you look carefully, you will notice that the track of my sailboat VALIS (captured during the start of the 2008 Pacific Cup) has gone over the shoreline and onto the rocky breakwater. I assure you that this did not really happen. As I mentioned, this database has not been checked for accuracy.
Here is a zip archive with .dat files from each of the four databases, covering the area shown above: Sample Files
Note that if you do not select the Zip archive option on the NOAA website, the .dat files you download may not have the proper end-of-line termination (this is a PC vs Unix issue). It is possible to read these files into Microsoft Word (or other editor) and convert them to the proper format having "Carriage-Return/Line-Feed" line termination. It is also possible to hand-edit these files, or to combine multiple coastline sections into a single file.